Bitcoin market has seen some major bullish momentum this week, despite volatility. Analysts signal that Bitcoin is tracing a textbook triangle pattern, signaling an impending breakout that could target fresh highs or trigger a sharp pullback.
What is A Triangle Pattern?
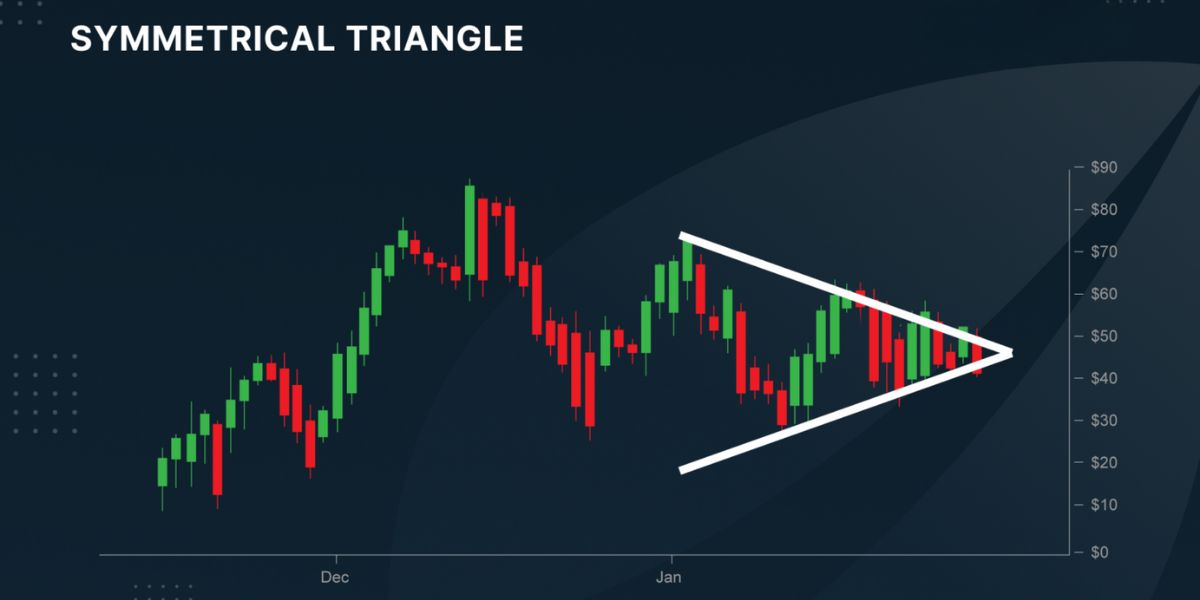
The triangle pattern, which is characterized by converging support and resistance trendlines, reflects a battle of control between buyers and sellers.

As the price inches closer to the apex of the triangle, the intensity builds, and a decisive breakout or breakdown becomes increasingly likely. The direction of the move usually dictates the intensity of the market’s next leg.
Bullish Momentum & Bitcoin
The technical setup that Bitcoin is heading towards arrives amid a wave of bullish sentiment across global markets. On August 14, Bitcoin touched a new record above $124,000. That was powered by broad expectations of Fed rate cuts, friendly crypto policies, and an inflow of institutional capital.
Looking ahead, analysts remain upbeat. A move past $125,000 could catapult Bitcoin toward the $150,000 range, especially if macro tailwinds hold strong.
What It All Means for Traders
A bullish triangle breakout could spark a strong rally. But traders are ready for sharp swings as a false breakdown may also trigger a rapid sell-off.
Despite this high volatility risk, favorable U.S. regulatory moves and steady ETF inflows continue to support demand, providing a solid macro backdrop that could strengthen any potential upward breakout.