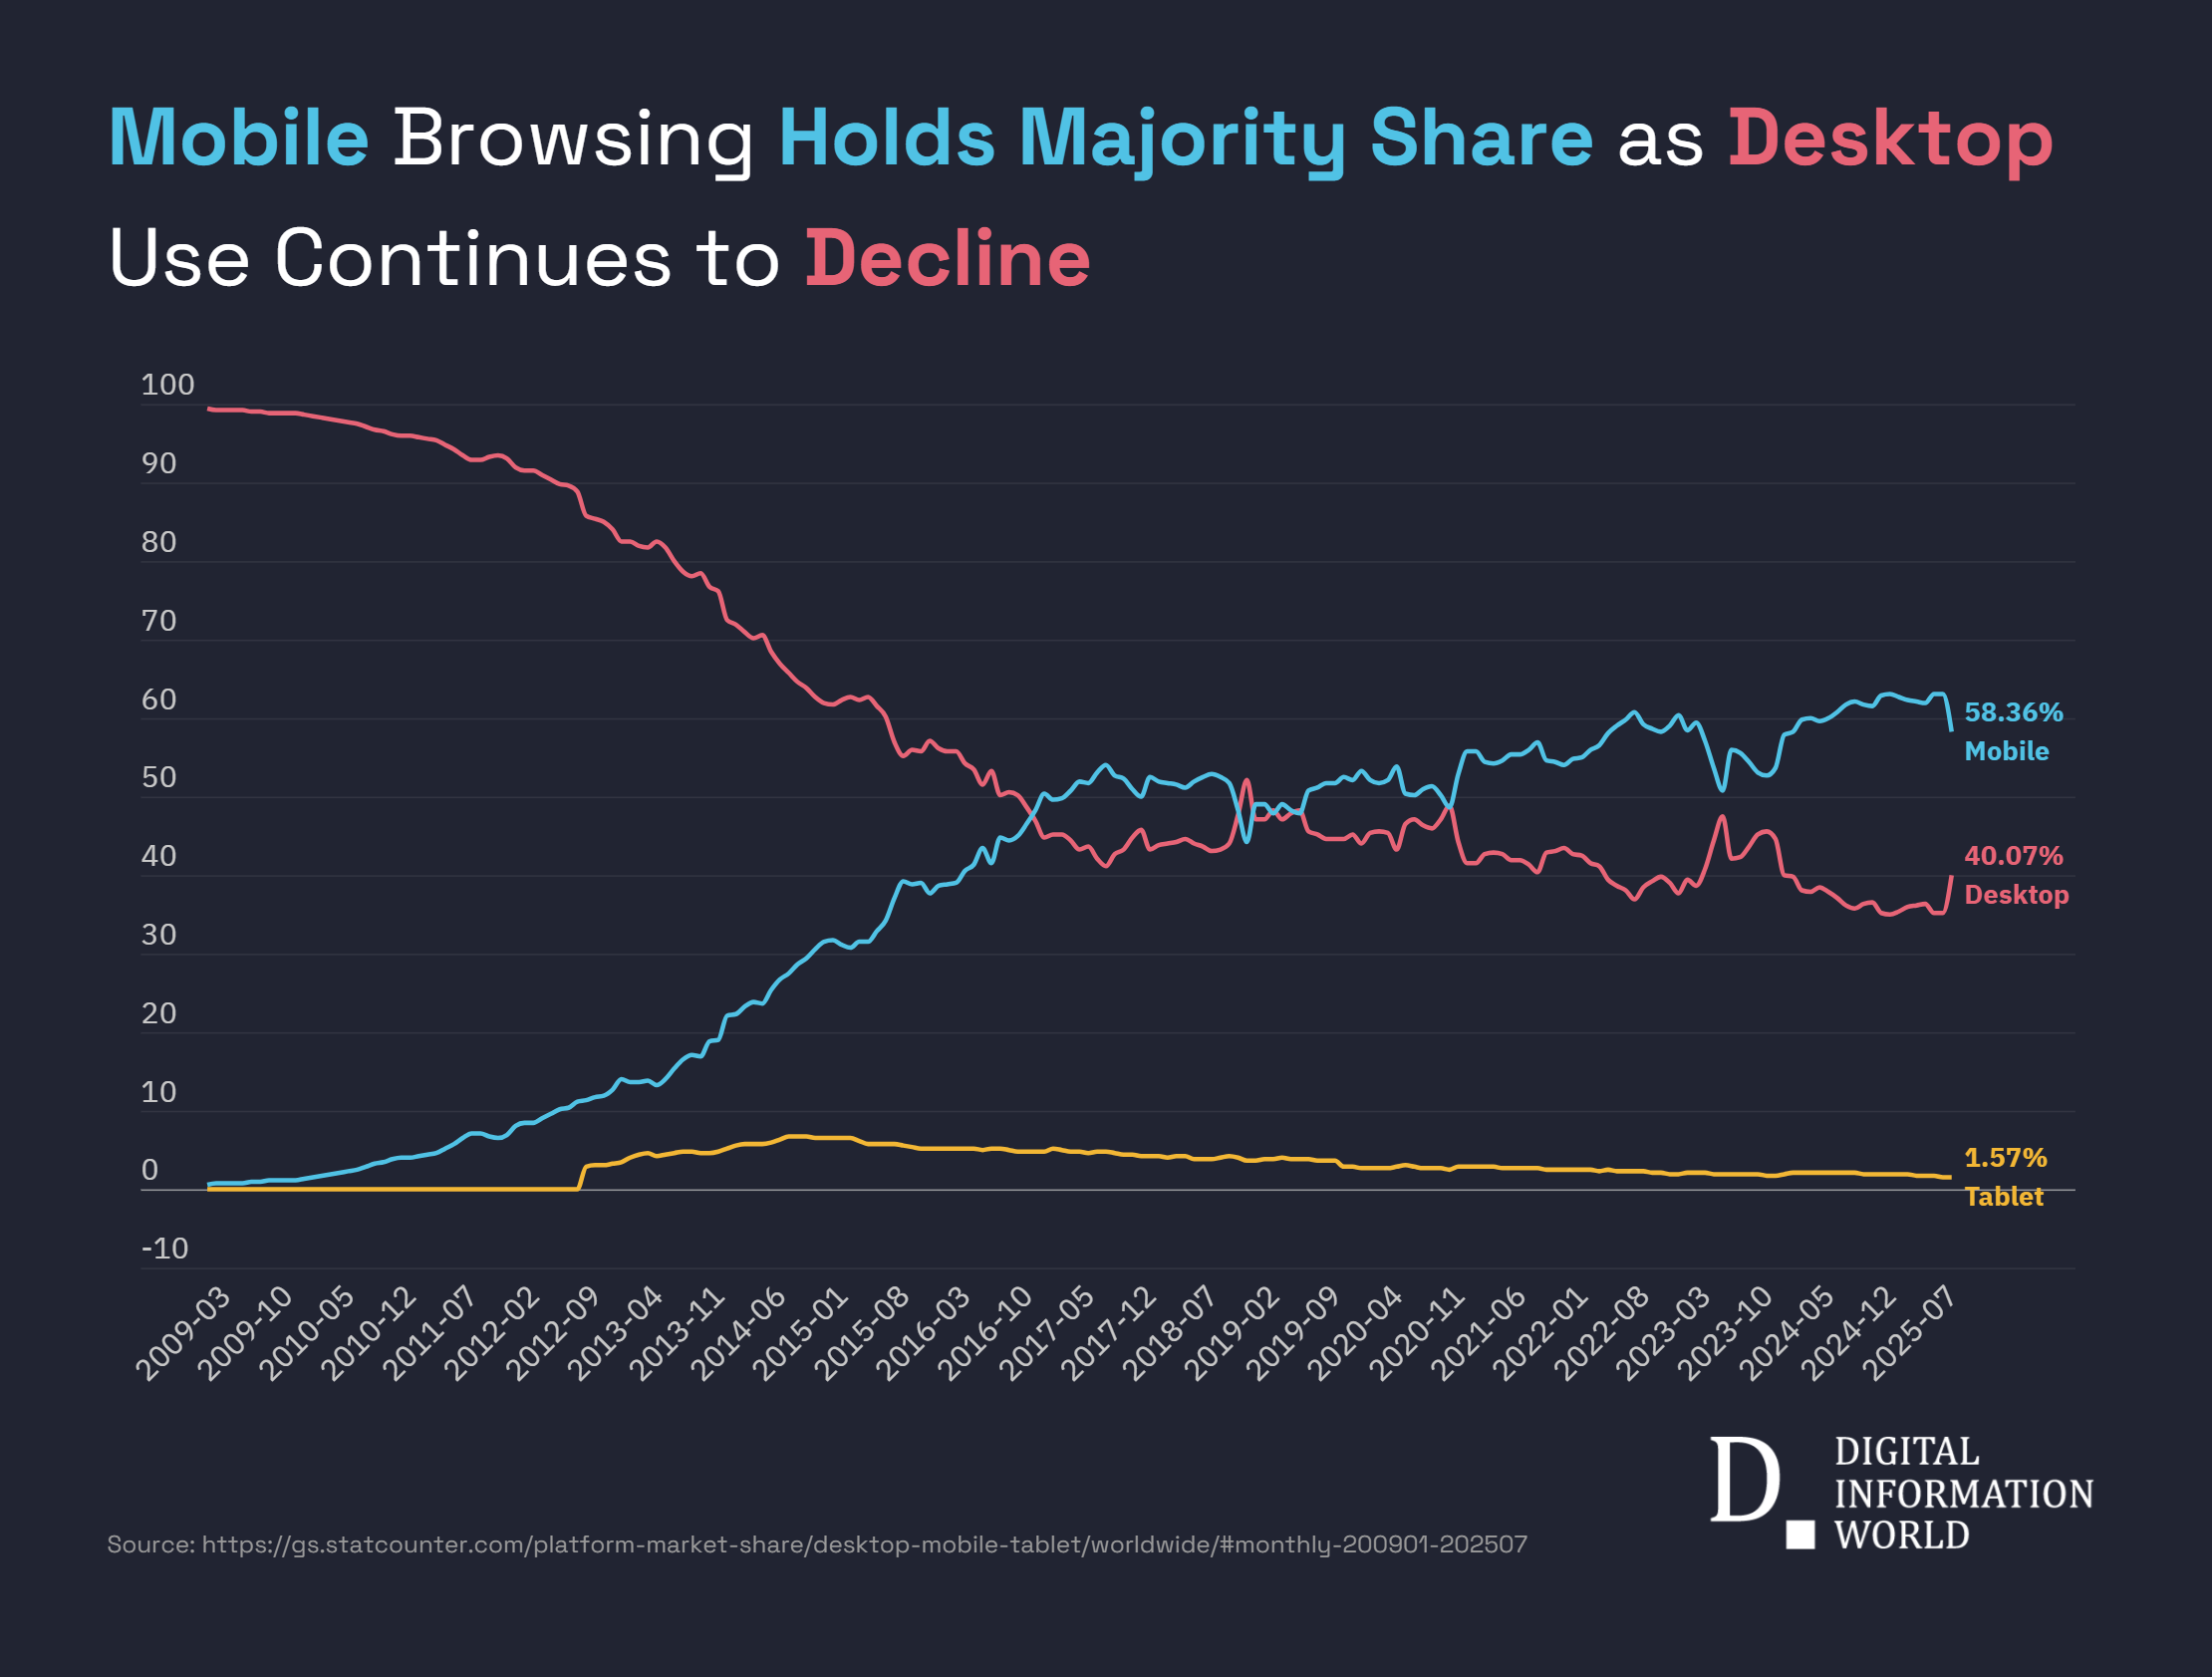
In early 2009, desktop devices dominated almost all internet activity, holding 99.3% of global web traffic, while mobile accounted for just 0.7% and tablets registered no measurable share. The following years saw a gradual erosion of desktop’s lead as mobile adoption accelerated, crossing the 10% mark by mid-2012. That year also marked the arrival of tablets as a measurable traffic source, though their share never exceeded single digits.
Between 2013 and 2015, mobile traffic grew steadily from under 20% to nearly 40%, while desktop’s share fell below two-thirds. By October 2016, mobile usage finally edged past desktop for the first time, with tablets contributing just under 5%. The gap widened quickly in subsequent years, reflecting the rise of mobile-first browsing habits and wider smartphone penetration across both developed and emerging markets.
From 2017 through 2021, mobile consistently held above 50% of global traffic, peaking at nearly 57% in December 2020. Desktop usage during that period stayed in the low-to-mid-40% range, while tablets gradually slid from about 5% to under 3%.
The trend continued through the early 2020s, with mobile surpassing 60% of traffic in mid-2022 and hovering near that level for much of the following two years. Tablets saw a modest but persistent decline, settling around 2% of traffic. Desktop usage, meanwhile, stabilized at just under 40% during most of this period.
As of July 2025, mobile accounts for 60.5% of all web traffic worldwide, compared to 39.5% for desktop and 1.6% for tablets. While seasonal and short-term fluctuations occasionally narrow the gap, the long-term trajectory suggests mobile will remain the dominant platform for internet access in the foreseeable future.

| Date (Year-Month) | Desktop (%) | Mobile (%) | Tablet (%) |
|---|---|---|---|
| 2009-01 | 99.33 | 0.67 | 0 |
| 2009-02 | 99.31 | 0.69 | 0 |
| 2009-03 | 99.2 | 0.8 | 0 |
| 2009-04 | 99.14 | 0.86 | 0 |
| 2009-05 | 99.14 | 0.86 | 0 |
| 2009-06 | 99.06 | 0.94 | 0 |
| 2009-07 | 98.95 | 1.05 | 0 |
| 2009-08 | 98.88 | 1.12 | 0 |
| 2009-09 | 98.88 | 1.12 | 0 |
| 2009-10 | 98.85 | 1.15 | 0 |
| 2009-11 | 98.79 | 1.21 | 0 |
| 2009-12 | 98.72 | 1.28 | 0 |
| 2010-01 | 98.44 | 1.56 | 0 |
| 2010-02 | 98.28 | 1.72 | 0 |
| 2010-03 | 98.04 | 1.96 | 0 |
| 2010-04 | 97.82 | 2.18 | 0 |
| 2010-05 | 97.68 | 2.32 | 0 |
| 2010-06 | 97.43 | 2.57 | 0 |
| 2010-07 | 97.14 | 2.86 | 0 |
| 2010-08 | 96.79 | 3.21 | 0 |
| 2010-09 | 96.5 | 3.5 | 0 |
| 2010-10 | 96.19 | 3.81 | 0 |
| 2010-11 | 95.98 | 4.02 | 0 |
| 2010-12 | 95.9 | 4.1 | 0 |
| 2011-01 | 95.7 | 4.3 | 0 |
| 2011-02 | 95.55 | 4.45 | 0 |
| 2011-03 | 95.3 | 4.7 | 0 |
| 2011-04 | 94.79 | 5.21 | 0 |
| 2011-05 | 94.25 | 5.75 | 0 |
| 2011-06 | 93.47 | 6.53 | 0 |
| 2011-07 | 92.98 | 7.02 | 0 |
| 2011-08 | 92.88 | 7.12 | 0 |
| 2011-09 | 93.26 | 6.74 | 0 |
| 2011-10 | 93.45 | 6.55 | 0 |
| 2011-11 | 93.05 | 6.95 | 0 |
| 2011-12 | 91.96 | 8.04 | 0 |
| 2012-01 | 91.51 | 8.49 | 0 |
| 2012-02 | 91.47 | 8.53 | 0 |
| 2012-03 | 91.01 | 8.99 | 0 |
| 2012-04 | 90.42 | 9.58 | 0 |
| 2012-05 | 89.89 | 10.11 | 0 |
| 2012-06 | 89.6 | 10.4 | 0 |
| 2012-07 | 88.91 | 11.09 | 0 |
| 2012-08 | 85.69 | 11.44 | 2.86 |
| 2012-09 | 85.33 | 11.66 | 3.01 |
| 2012-10 | 85.02 | 11.92 | 3.06 |
| 2012-11 | 84.13 | 12.66 | 3.22 |
| 2012-12 | 82.42 | 14.04 | 3.54 |
| 2013-01 | 82.41 | 13.56 | 4.03 |
| 2013-02 | 81.86 | 13.71 | 4.43 |
| 2013-03 | 81.69 | 13.79 | 4.52 |
| 2013-04 | 82.43 | 13.31 | 4.27 |
| 2013-05 | 81.68 | 13.98 | 4.33 |
| 2013-06 | 80.01 | 15.33 | 4.66 |
| 2013-07 | 78.66 | 16.51 | 4.83 |
| 2013-08 | 78.08 | 17.14 | 4.78 |
| 2013-09 | 78.39 | 16.98 | 4.63 |
| 2013-10 | 76.68 | 18.78 | 4.54 |
| 2013-11 | 76.13 | 19.08 | 4.78 |
| 2013-12 | 72.55 | 22.18 | 5.27 |
| 2014-01 | 71.95 | 22.39 | 5.66 |
| 2014-02 | 70.99 | 23.25 | 5.76 |
| 2014-03 | 70.23 | 23.93 | 5.84 |
| 2014-04 | 70.61 | 23.56 | 5.83 |
| 2014-05 | 68.55 | 25.41 | 6.04 |
| 2014-06 | 66.93 | 26.66 | 6.4 |
| 2014-07 | 65.83 | 27.51 | 6.66 |
| 2014-08 | 64.65 | 28.57 | 6.78 |
| 2014-09 | 63.84 | 29.36 | 6.8 |
| 2014-10 | 62.77 | 30.67 | 6.56 |
| 2014-11 | 61.92 | 31.54 | 6.54 |
| 2014-12 | 61.68 | 31.82 | 6.5 |
| 2015-01 | 62.38 | 31.06 | 6.55 |
| 2015-02 | 62.62 | 30.81 | 6.57 |
| 2015-03 | 62.26 | 31.58 | 6.17 |
| 2015-04 | 62.71 | 31.56 | 5.73 |
| 2015-05 | 61.49 | 32.82 | 5.69 |
| 2015-06 | 60.11 | 34.21 | 5.68 |
| 2015-07 | 57 | 37.15 | 5.85 |
| 2015-08 | 55.22 | 39.18 | 5.6 |
| 2015-09 | 55.91 | 38.78 | 5.31 |
| 2015-10 | 55.86 | 39.01 | 5.14 |
| 2015-11 | 57.21 | 37.62 | 5.17 |
| 2015-12 | 56.25 | 38.62 | 5.13 |
| 2016-01 | 55.86 | 38.88 | 5.26 |
| 2016-02 | 55.82 | 38.96 | 5.22 |
| 2016-03 | 54.19 | 40.6 | 5.2 |
| 2016-04 | 53.54 | 41.32 | 5.14 |
| 2016-05 | 51.46 | 43.5 | 5.04 |
| 2016-06 | 53.22 | 41.61 | 5.16 |
| 2016-07 | 50.1 | 44.75 | 5.15 |
| 2016-08 | 50.61 | 44.41 | 4.98 |
| 2016-09 | 50.28 | 44.91 | 4.81 |
| 2016-10 | 48.74 | 46.53 | 4.73 |
| 2016-11 | 46.93 | 48.25 | 4.82 |
| 2016-12 | 44.79 | 50.31 | 4.9 |
| 2017-01 | 45.27 | 49.6 | 5.13 |
| 2017-02 | 45.23 | 49.73 | 5.04 |
| 2017-03 | 44.36 | 50.75 | 4.88 |
| 2017-04 | 43.23 | 51.95 | 4.82 |
| 2017-05 | 43.59 | 51.7 | 4.71 |
| 2017-06 | 42.19 | 53.03 | 4.78 |
| 2017-07 | 41.22 | 53.99 | 4.79 |
| 2017-08 | 42.75 | 52.64 | 4.62 |
| 2017-09 | 43.29 | 52.29 | 4.42 |
| 2017-10 | 44.78 | 50.87 | 4.35 |
| 2017-11 | 45.68 | 50.02 | 4.3 |
| 2017-12 | 43.26 | 52.48 | 4.26 |
| 2018-01 | 43.87 | 51.92 | 4.21 |
| 2018-02 | 44.12 | 51.82 | 4.06 |
| 2018-03 | 44.27 | 51.56 | 4.18 |
| 2018-04 | 44.66 | 51.2 | 4.14 |
| 2018-05 | 44.1 | 52 | 3.89 |
| 2018-06 | 43.63 | 52.52 | 3.85 |
| 2018-07 | 43.11 | 52.95 | 3.94 |
| 2018-08 | 43.33 | 52.54 | 4.13 |
| 2018-09 | 44.12 | 51.7 | 4.18 |
| 2018-10 | 47.78 | 48.2 | 4.03 |
| 2018-11 | 52.07 | 44.19 | 3.74 |
| 2018-12 | 47.2 | 49.06 | 3.74 |
| 2019-01 | 47.02 | 49.11 | 3.87 |
| 2019-02 | 48.21 | 47.96 | 3.83 |
| 2019-03 | 47.04 | 48.98 | 3.98 |
| 2019-04 | 47.79 | 48.32 | 3.9 |
| 2019-05 | 48.27 | 47.9 | 3.84 |
| 2019-06 | 45.53 | 50.71 | 3.76 |
| 2019-07 | 45.18 | 51.11 | 3.71 |
| 2019-08 | 44.6 | 51.65 | 3.75 |
| 2019-09 | 44.57 | 51.78 | 3.65 |
| 2019-10 | 44.59 | 52.48 | 2.93 |
| 2019-11 | 45.17 | 52.03 | 2.8 |
| 2019-12 | 43.99 | 53.29 | 2.72 |
| 2020-01 | 45.29 | 52.02 | 2.7 |
| 2020-02 | 45.66 | 51.69 | 2.65 |
| 2020-03 | 45.32 | 52.03 | 2.65 |
| 2020-04 | 43.27 | 53.81 | 2.92 |
| 2020-05 | 46.51 | 50.48 | 3 |
| 2020-06 | 47.06 | 50.13 | 2.81 |
| 2020-07 | 46.39 | 50.88 | 2.74 |
| 2020-08 | 45.9 | 51.33 | 2.78 |
| 2020-09 | 47.17 | 50.21 | 2.62 |
| 2020-10 | 48.88 | 48.62 | 2.5 |
| 2020-11 | 44.22 | 52.95 | 2.83 |
| 2020-12 | 41.46 | 55.73 | 2.81 |
| 2021-01 | 41.45 | 55.68 | 2.87 |
| 2021-02 | 42.63 | 54.46 | 2.91 |
| 2021-03 | 42.93 | 54.22 | 2.85 |
| 2021-04 | 42.66 | 54.57 | 2.76 |
| 2021-05 | 41.98 | 55.3 | 2.72 |
| 2021-06 | 41.96 | 55.4 | 2.64 |
| 2021-07 | 41.36 | 55.89 | 2.74 |
| 2021-08 | 40.39 | 56.86 | 2.75 |
| 2021-09 | 42.87 | 54.61 | 2.52 |
| 2021-10 | 43.15 | 54.37 | 2.48 |
| 2021-11 | 43.55 | 53.98 | 2.48 |
| 2021-12 | 42.65 | 54.86 | 2.49 |
| 2022-01 | 42.54 | 54.98 | 2.47 |
| 2022-02 | 41.59 | 55.98 | 2.43 |
| 2022-03 | 41.15 | 56.45 | 2.4 |
| 2022-04 | 39.37 | 58.16 | 2.47 |
| 2022-05 | 38.65 | 59.02 | 2.33 |
| 2022-06 | 37.99 | 59.74 | 2.27 |
| 2022-07 | 37 | 60.73 | 2.27 |
| 2022-08 | 38.53 | 59.25 | 2.22 |
| 2022-09 | 39.27 | 58.64 | 2.09 |
| 2022-10 | 39.72 | 58.27 | 2.02 |
| 2022-11 | 39 | 59.02 | 1.98 |
| 2022-12 | 37.71 | 60.29 | 2 |
| 2023-01 | 39.41 | 58.52 | 2.07 |
| 2023-02 | 38.6 | 59.36 | 2.04 |
| 2023-03 | 40.8 | 57.18 | 2.02 |
| 2023-04 | 44.4 | 53.61 | 1.99 |
| 2023-05 | 47.41 | 50.71 | 1.88 |
| 2023-06 | 42.2 | 55.87 | 1.92 |
| 2023-07 | 42.4 | 55.67 | 1.93 |
| 2023-08 | 43.72 | 54.41 | 1.87 |
| 2023-09 | 45.13 | 53.03 | 1.84 |
| 2023-10 | 45.54 | 52.69 | 1.77 |
| 2023-11 | 44.52 | 53.66 | 1.82 |
| 2023-12 | 40.08 | 57.97 | 1.95 |
| 2024-01 | 39.76 | 58.21 | 2.03 |
| 2024-02 | 38 | 59.9 | 2.11 |
| 2024-03 | 37.8 | 60.01 | 2.2 |
| 2024-04 | 38.41 | 59.57 | 2.02 |
| 2024-05 | 37.85 | 60.08 | 2.07 |
| 2024-06 | 37.1 | 60.74 | 2.17 |
| 2024-07 | 36.1 | 61.74 | 2.16 |
| 2024-08 | 35.72 | 62.15 | 2.13 |
| 2024-09 | 36.36 | 61.66 | 1.98 |
| 2024-10 | 36.56 | 61.59 | 1.85 |
| 2024-11 | 35.2 | 62.96 | 1.84 |
| 2024-12 | 35.07 | 63.07 | 1.86 |
| 2025-01 | 35.43 | 62.69 | 1.88 |
| 2025-02 | 35.91 | 62.23 | 1.85 |
| 2025-03 | 36.06 | 62.21 | 1.72 |
| 2025-04 | 36.3 | 62.01 | 1.7 |
| 2025-05 | 35.28 | 63.07 | 1.65 |
| 2025-06 | 35.24 | 63.13 | 1.63 |
| 2025-07 | 40.07 | 58.36 | 1.57 |
Notes: This post was edited/created using GenAI tools.
Read next: Grok Leads Global GenAI Website Growth in July, DeepSeek Records Sharpest Decline