The world of crypto is holding its breath, waiting for the Federal Reserve to introduce a new interest rate decision. Bitcoin (BTC) continues to tread water in a tight range between $116,000 and $120,000, hinting at a market caught in a stalemate.
Let’s take a look at how crypto is holding up.


Bitcoin Oscillates Between $116,000 to $120,000
Since reaching a new all-time high of $123,218 on July 14, BTC has been consolidating with low conviction from either bulls or bears. Currently trading at $118,000, traders are watching key technical levels like hawks ahead of the U.S. Federal Reserve’s interest rate decision due any time this week.

If BTC drops below $116,000, the downside may deepen toward the 50-day EMA at $112,735. Adding to bearish anxiety, both the Relative Strength Index (RSI) at 58 and the MACD indicators suggest weakening bullish momentum. The MACD’s red histogram bar below neutral confirms a bearish crossover, a classic warning sign for further declines.
However, a daily close above $120,000 could recharge bullish sentiment, paving the way for a retest of the ATH at $123,218.
Ethereum Holds $3,730 Support Amid Bullish RSI
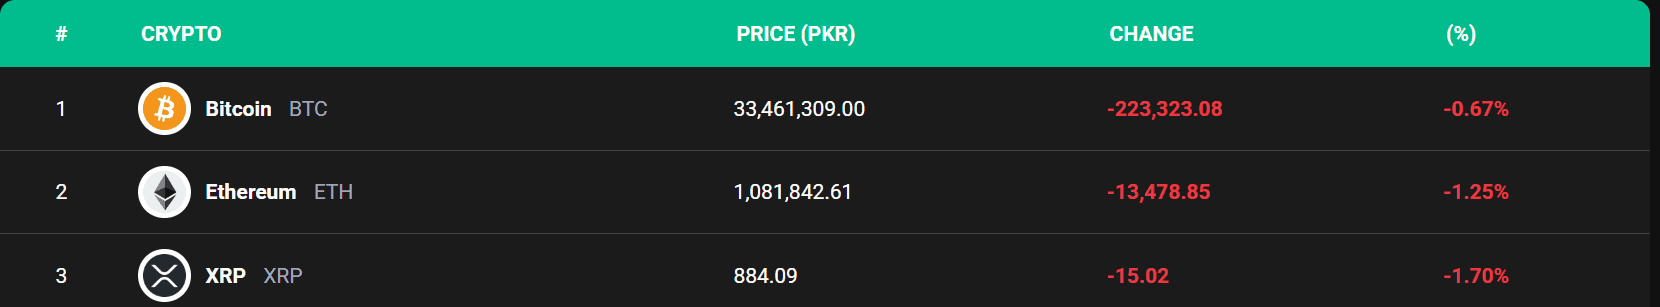
Ethereum (ETH) showed relative strength by bouncing off $3,500 on July 24 and reclaiming its daily resistance at $3,730. After notching a year-to-date high of $3,940 on Monday, ETH has slightly cooled off but remains perched above the $3,730 mark. In PKR, that is:

The RSI stands at a sizzling 75, deep in overbought territory but still allowing room for further upside—potentially toward the psychological $4,000 mark. However, the MACD is beginning a bearish crossover, suggesting this rally may be nearing exhaustion.
If ETH falls below $3,730, a slide toward $3,500 could be imminent.
XRP Clings To $2.99 Lifeline As Interest Rate Decision Looms
XRP’s technical posture remains fragile after a sharp 11% drop post-July 23, which saw it tumble from $3.40 to $2.99, a critical 61.8% Fibonacci level. While it has since rebounded slightly to hover around $3.13, indicators warn that XRP is skating on thin ice.
The RSI at 58 suggests neutrality, but the downward slope hints at fading momentum. The MACD’s bearish crossover and expanding red histogram also point to a potential continuation of the downtrend.
If XRP holds the line at $2.99, a rebound to $3.40 is possible. But if it cracks below, traders should brace for a decline toward $2.72.
Why U.S. Interest Rate Decision Matters
With all eyes on the Fed’s upcoming rate decision, crypto markets are preparing for heightened volatility. Bitcoin’s price prediction remains tethered to macroeconomic catalysts, while Ethereum and XRP wrestle with their technical crossroads. Check the ups and downs of the crypto prices next to PKR with our cryptocurrency converter here.