United States Anchors the Field
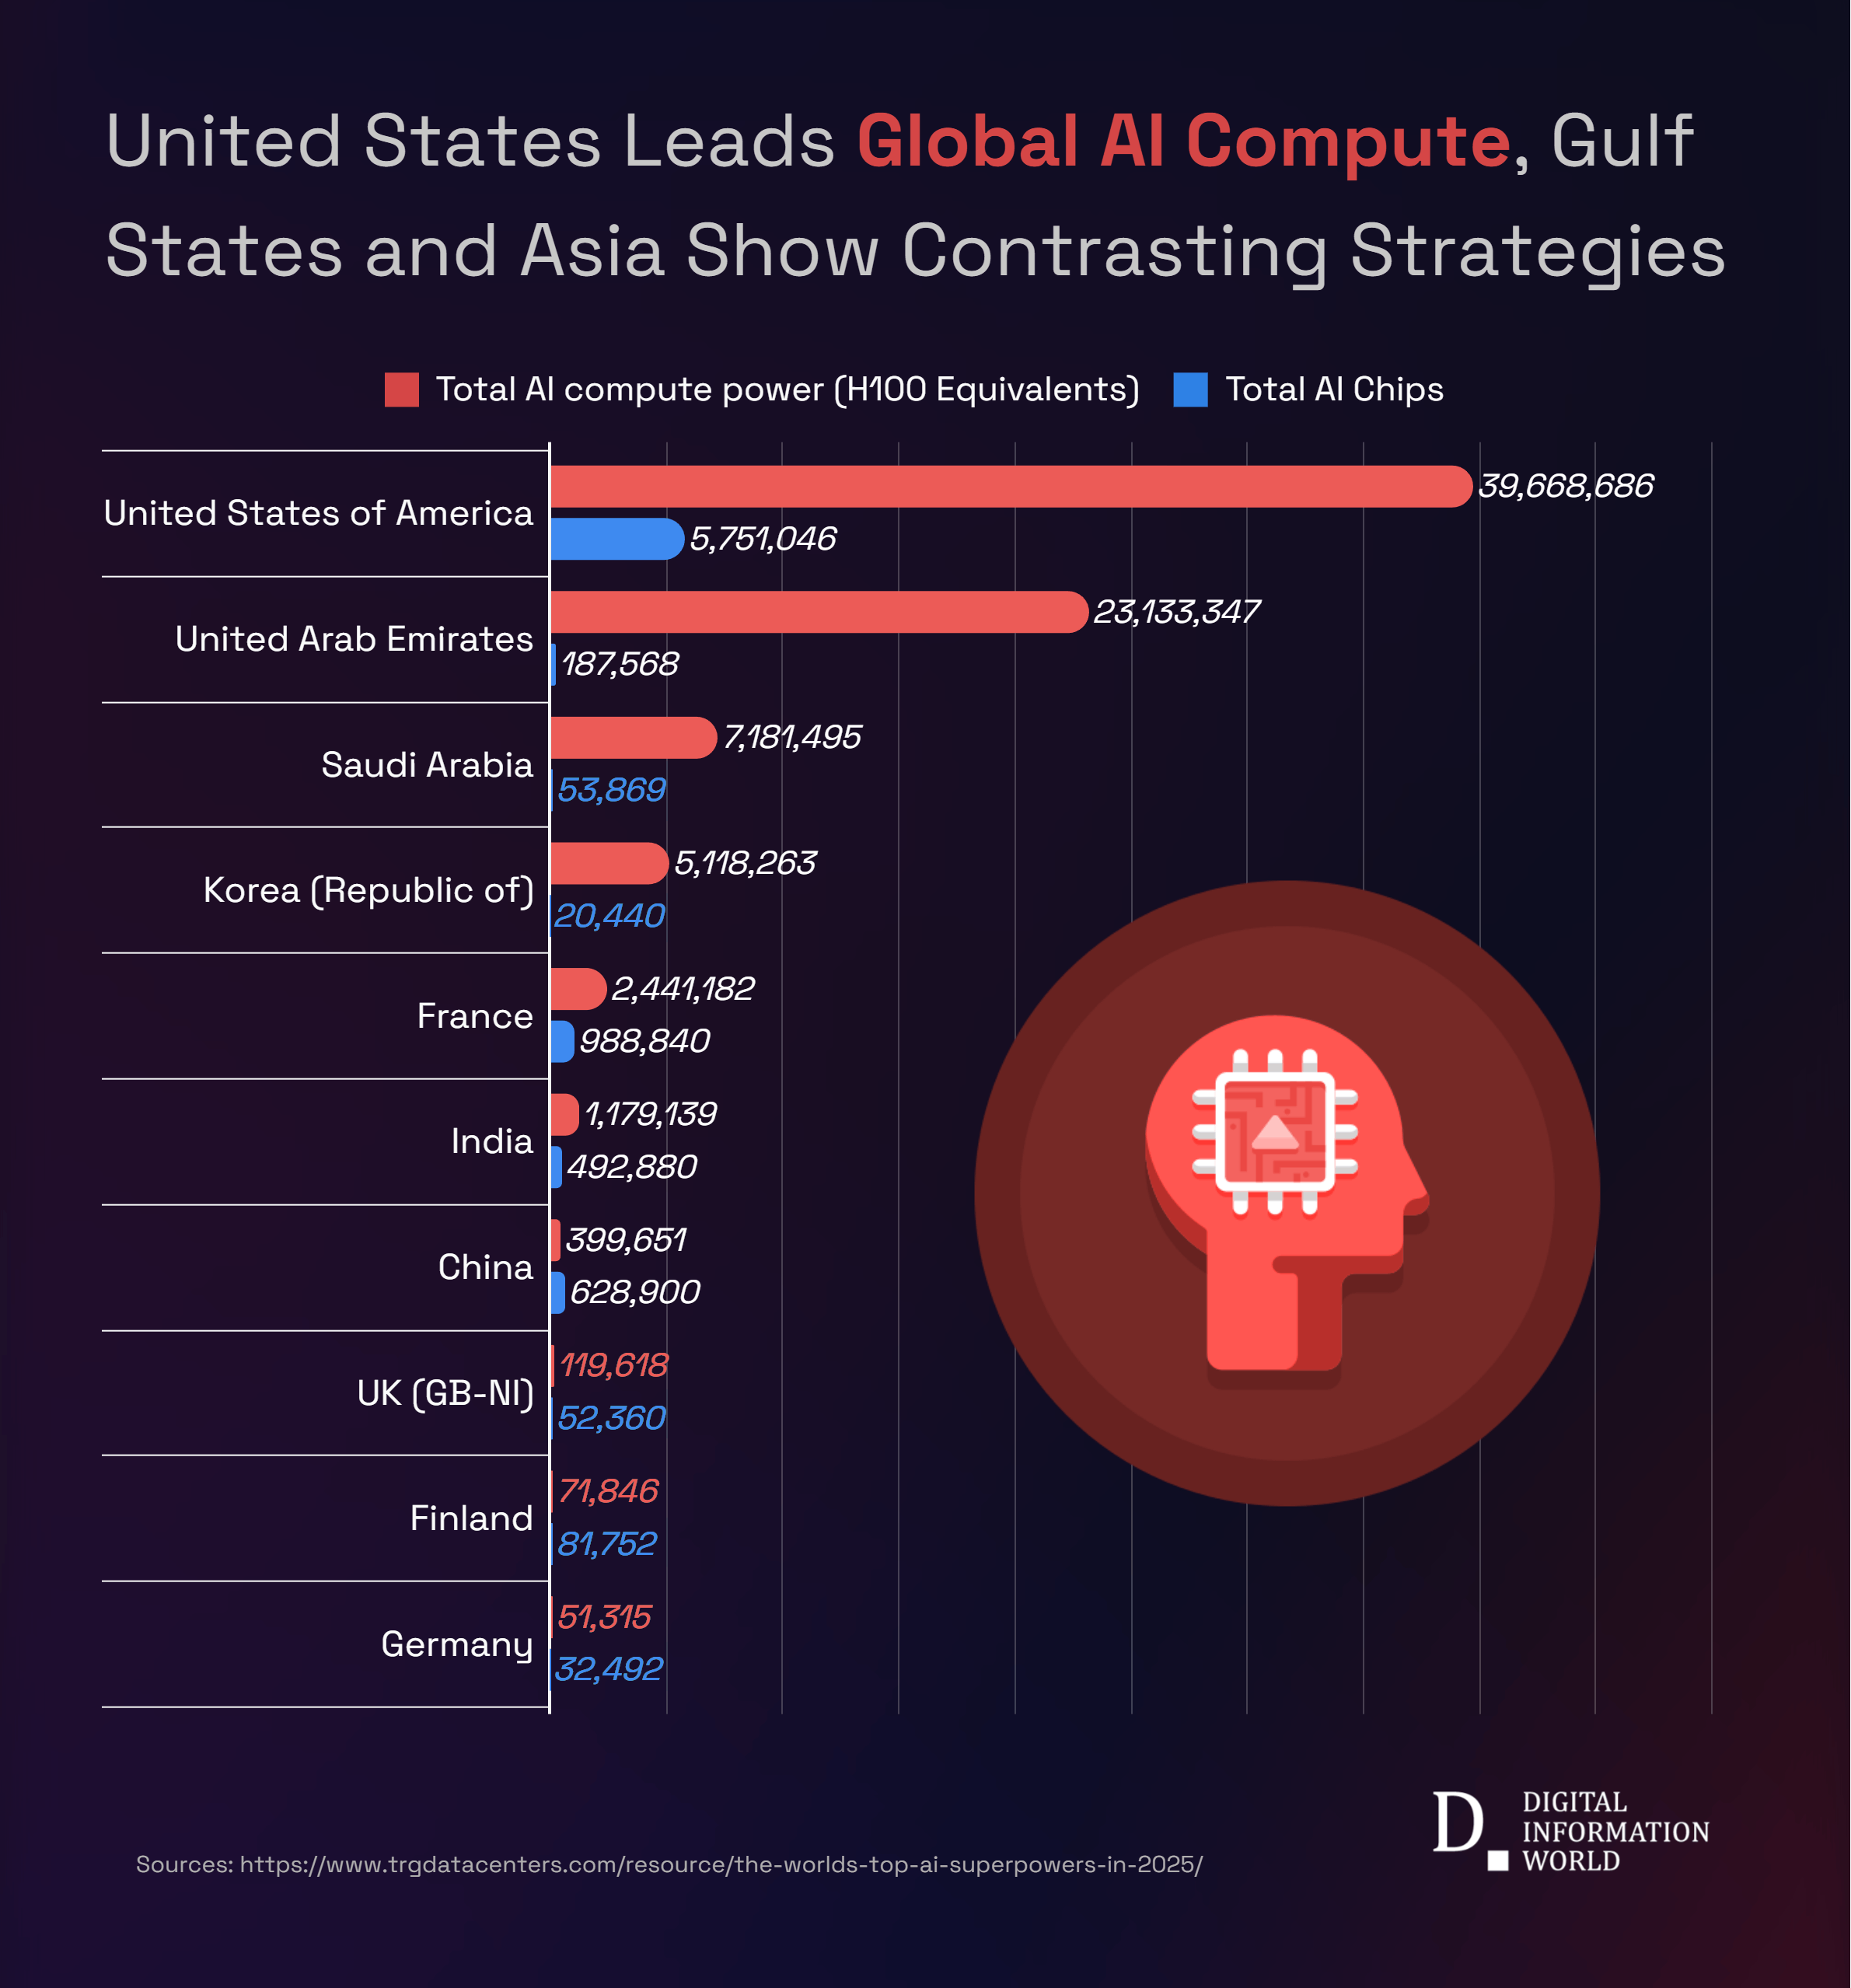
The United States, as per TRGDataCenters study[1], remains the most powerful nation in artificial intelligence this year. Its systems run the equivalent of nearly 40 million NVIDIA H100 chips, supported by about 19,800 megawatts of power capacity. That combination gives the country roughly half of all global AI compute. Alongside the hardware advantage, more than one in ten American workers are now engaged in AI-related roles, reflecting widespread adoption across industries.

Gulf States Rise Through Heavy Investment
The Middle East has emerged as a new center of AI strength. The United Arab Emirates controls over 23 million H100 equivalents with only eight clusters, backed by 6,400 megawatts of energy. Saudi Arabia follows closely with 7.2 million equivalents from nine clusters. Despite smaller populations, both states are redirecting oil wealth into long-term digital infrastructure, betting that artificial intelligence will define the next phase of economic growth.
Asia Shows Contrasts
South Korea holds fourth place, running about 5.1 million equivalents from 13 clusters. Its workforce profile is striking: nearly half of all employees use AI tools in some capacity, a level unmatched elsewhere.
India sits in sixth position with 1.2 million equivalents. It operates eight clusters and owns nearly half a million chips, giving it the third-largest chip base after the U.S. and China. Still, its compute scale remains limited compared with the leaders.
China presents a paradox. It owns more clusters than any other nation, with 230 facilities and about 629,000 chips, yet delivers only 400,000 H100 equivalents. Restrictions on advanced chip imports and reliance on less powerful units help explain the gap. This structure has encouraged Chinese labs to focus on efficiency, prioritizing models that do more with fewer resources.
European Efforts
France stands in fifth place, running 2.4 million equivalents through 18 clusters. It also holds nearly one million chips, second only to the U.S. Germany, by contrast, closes the top ten. Despite 12 clusters and strong industrial traditions, its compute measures only 51,000 equivalents with limited power capacity of 25 megawatts.
The United Kingdom ranks eighth at 120,000 equivalents, supported by a modest 99 megawatts of capacity but paired with one of Europe’s more active startup ecosystems. Finland, in ninth place, contributes 72,000 equivalents across five clusters, with a workforce highly engaged in AI despite smaller national scale.
Energy Demands of Global Compute
Together, the leading ten nations manage about 496 clusters. Their systems provide compute power equal to 79 million H100 chips, or roughly 79 exaflops. To put that into perspective, the figure is seventy times the output of the world’s fastest public supercomputer. If fully engaged, these systems would draw about 55 gigawatts of electricity, matching California’s summer peak demand or the combined load of countries such as the United Kingdom and Spain.
Beyond Hardware: Workforce and Policy
The rankings highlight that raw compute is only one measure of influence. Nations also rely on skilled workers, corporate uptake, and government strategies to translate power into long-term advantage. Global spending reflects the urgency: investment in AI infrastructure reached about 200 billion dollars this year, setting a record. Some states are concentrating resources on building the largest possible clusters, while others emphasize chip specialization, regulatory incentives, or workforce development.
Outlook
The United States remains firmly ahead, yet the distribution of compute power is shifting. Gulf states are rapidly expanding, Asian nations balance scale with efficiency, and European players search for a competitive foothold. The outcome of this contest will shape not only economic leadership but also who controls the technologies that define modern life.
| Country | Number of Clusters | Total AI compute power (H100 Equivalents) | Avg Max OP/s (log) | Total Power Capacity (MW) | Total AI Chips | AI-Related Engagement % of Total Employment (Approximate) | AI Companies | AI Readiness Index |
|---|---|---|---|---|---|---|---|---|
| United States of America | 187 | 39,668,686 | 18.56 | 19817.9 | 5,751,046 | 10.40% | 17,500 | 87 |
| United Arab Emirates | 8 | 23,133,347 | 19.95 | 6363 | 187,568 | 1.80% | 702 | 70 |
| Saudi Arabia | 9 | 7,181,495 | 19.71 | 2394.6 | 53,869 | 2.29% | 307 | 67 |
| Korea (Republic of) | 13 | 5,118,263 | 18.3 | 3024.4 | 20,440 | 50.00% | #N/A | #N/A |
| France | 18 | 2,441,182 | 18.75 | 1975.5 | 988,840 | 22.00% | 1,674 | 76 |
| India | 8 | 1,179,139 | 18.93 | 1059.7 | 492,880 | 0.10% | #N/A | #N/A |
| China | 230 | 399,651 | 17.41 | 288.6 | 628,900 | 0.14% | #N/A | #N/A |
| UK (GB-NI) | 6 | 119,618 | 18.09 | 99.1 | 52,360 | 6.50% | 4,705 | 79 |
| Finland | 5 | 71,846 | 18.6 | 110.1 | 81,752 | 16.00% | 337 | 77 |
| Germany | 12 | 51,315 | 17.84 | 25.2 | 32,492 | 33.50% | 2,323 | 75 |
| Japan | 31 | 51,184 | 17.73 | 77.9 | 74,640 | 20.00% | 2,283 | 75 |
| Malaysia | 1 | 38,979 | 19.89 | 37.1 | 15,428 | 0.02% | #N/A | #N/A |
| Taiwan | 5 | 25,985 | 18.5 | 44.8 | 18,416 | 3.50% | #N/A | #N/A |
| Sweden | 7 | 24,943 | 18.49 | 7.4 | 25,774 | 25.00% | 533 | 73 |
| Italy | 10 | 22,773 | 17.78 | 53.8 | 54,442 | 1.90% | 1,219 | 68 |
| Norway | 3 | 20,480 | 18.91 | 29.2 | 20,480 | 0.17% | 235 | 73 |
| Switzerland | 4 | 17,236 | 18.06 | 26.8 | 25,896 | 47.00% | 822 | 69 |
| Thailand | 4 | 6,270 | 18.29 | 9.1 | 6,752 | 0.05% | #N/A | #N/A |
| Singapore | 4 | 6,216 | 17.96 | 9 | 6,632 | 0.21% | 1,195 | 82 |
| Australia | 4 | 4,725 | 17.81 | 7.6 | 5,944 | 0.23% | 1,216 | 74 |
| Spain | 1 | 4,480 | 18.95 | 6 | 4,480 | 2.00% | 1,078 | 67 |
| Canada | 5 | 3,109 | 17.66 | 5.5 | 4,908 | 0.67% | 2,697 | 77 |
| Israel | 2 | 3,072 | 18.46 | 4.4 | 3,072 | 1.98% | 1,445 | 65 |
| Vietnam | 2 | 3,050 | 17.89 | 4.3 | 3,160 | 0.00% | #N/A | #N/A |
| Denmark | 1 | 3,032 | 18.78 | 2.9 | 1,528 | 20.00% | 294 | 74 |
| Hong Kong | 3 | 2,900 | 18.14 | 0.6 | 400 | 1.90% | #N/A | #N/A |
| Russia | 8 | 1,772 | 17.38 | 5.7 | 7,500 | 24.00% | #N/A | #N/A |
| Brazil | 9 | 1,252 | 17.16 | 7.3 | 8,160 | 0.01% | #N/A | #N/A |
| Poland | 4 | 1,237 | 17.74 | 1.8 | 1,500 | 0.21% | 467 | 63 |
| Netherlands | 3 | 947 | 17.7 | 2.1 | 2,240 | 0.09% | 863 | 74 |
| Luxembourg | 1 | 252 | 17.7 | 0.7 | 800 | 1.45% | #N/A | #N/A |
| Iceland | 1 | 248 | 17.69 | 0.4 | 248 | 5.73% | 31 | 69.59 |
| Czechia | 1 | 182 | 17.56 | 0.5 | 576 | 38.00% | #N/A | #N/A |
| Slovenia | 1 | 76 | 17.18 | 0.2 | 240 | 0.03% | 32 | 62.63 |
Notes: This post was edited/created using GenAI tools.
Read next: Study Reveals AI Assistants Link to Broken Pages More Often Than Google[2]
References
- ^ TRGDataCenters study (www.trgdatacenters.com)
- ^ Study Reveals AI Assistants Link to Broken Pages More Often Than Google (www.digitalinformationworld.com)